- The Probability Scale
- The Averages
Firstly, Probability of an event is a measure of how likely an event is likely to happen. The probability of a fair event, can be found using the formula :
For Some Event E :
P(E) = Number of ways the event E can occur / The number of possible outcomes
The probability of events, can be shown using a probability scale :
 |
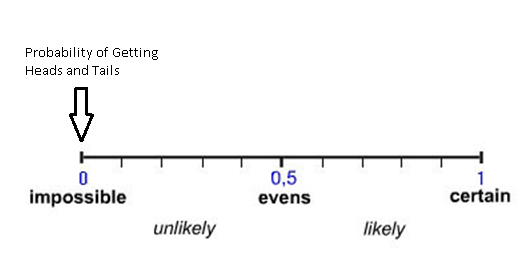
| The Probability Scale |
This is an example of the probability scale, it is basically in simple terms a number line from 0 to 1. Probability can only be between 0 and 1. If it is 0, that means that event can never happen (impossible), if it is 1, that means it will always happen (certain). If it is 1/2, there is even chance of it happening. This is best demonstrated using an example :
Example :
Susan flips a fair coin. On the probability scale, mark the probability that :
a) The outcome will be heads
b) The outcome will be tails
c) The outcome will be heads or tails
d) The outcome will heads and tails
A fair coin has 2 sides (number of possible outcomes = 2), one is heads, one is tails, so each outcome (heads or tails), only appears once. Using the formula :
P(Heads) = 1 / 2
P(Tails) = 1/2
There is no other outcome other than heads or tails, so the probability of getting heads or tails is :
P(Heads or Tails) = 1
The coin can only land on either heads or tails, not on both so:
P(Heads and Tails) = 0
a)

b)

c)

d)
Example 2 (Exam Style)
There are 4 numbered cars in a bag. They are numbered 1,3,5 and 7. A card is drawn at random. On the Probability Scale, mark with a letter, the probability:
i) 3 will be drawn (mark with letter A)
ii) an even number will be drawn (mark with letter B)
iii) a number greater than 2 will be drawn (mark with letter C)
iv) a number less than 8 will be drawn (mark with letter D)
i) Work out the probability using the formula :
3 occurs once in the bag (number of ways an event can occur), there are 4 possible outcomes.
so P(3) = 1/4 or 0.25
ii) An Even number, is a multiple of 2, there are no even numbers in the bag, so
P(Even Number) = 0
iii) A number greater than 2. The numbers greater than 2 are 3,5 and 7. So the number of ways an event occur is 3, and total possible outcomes is 4.
P(Greater than 2) = 3 /4 or 0.75
iv) A number less than 8. All the numbers are less than 8, so total number of outcomes is 4, number ways an event can occur is 4, so
P(Less than 8) = 1

Anything less than 1/2 (0.5) is unlikely to happen, anything more is likely to happen. The scale in this case goes up in 0.1's, the one in the exam might just show 0, 0.5 and 1. With no lines, you would have to roughly mark any other probabilities asked for.
Exercise Question 1)
There are 4 sweets in a bag.
There are 2 toffees, a mint and a jelly baby.
A sweet is taken at random
On the probability scale, mark with a letter, the probability that :
i) a mint will be taken (use letter A)
ii) a toffee will be taken (use letter B)
iii) a sherbet lemon will be taken (use letter C)
THE AVERAGES
The Averages of Data, can be used to gather many different conclusions about the data, they are known to be measures of Central Tendency, which is a term used in Statistics.
The Averages are :
- Mean
- Median
- Mode
- Range
The Median is basically the middle value, that seperates the higher half from the lower half.
The Mode, is the most occuring / frequent value in the dataset.
The Range is the highest value in the highest value in the dataset minus the smallest value in the dataset.
Example:
2,10,4,1,3,3,1,3,9
The Mean = sum of all numbers / size of dataset (how many values there are)
=(2 + 10 + 4 + 1 + 3 + 3 + 1 + 3 + 9) / 9
=36/9
= 4 is the mean
The Mode, is the most occuring number,
= 3 is the mode
The Median is the middle number, first put the numbers in ascending order :
1,1,2,3,3,3,4,9,10
Then count how many numbers they are : 9
Divide that by 2 : 4.5
The median will be the 4.5th item ?
To find this we get the 4th item (3) and 5th item(3), add them up (6) and divide by 2 which is 3.
= 3 is the median
Range is the biggest number - smallest number, so :
= 10 -1
= 9 is the Range
Tricky Median Questions :
a) Find the median of the list:
2,5,6,8,8,9
The item which is the median is in =
( n + 1 ) / 2
n= number of values in dataset
here:
item which median is in = (6 + 1) / 2
= 3.5th item
So whenever we have a decimal as such, we take the 3rd item (6) and 4th item (8), take the sum which is 14. Divide that by 2, which is 7.
So the median is 7.
Exercise Question 2)
Sara measured the temperature at midnight for 12 nights during March. Here are the results :
-3 , -1 , 4 , 6 , 2 , -5 , 6 , 8 , 2 , 0 , 3 , 2
Find :
a) The mean temperature
b) The median temperature
c) The range of temperatures
d) The mode of temperatures
Averages from a Table
Sometimes a list won't be given. A Frequency Table will be given as a data form, to work out the averages from here, read the following example :
Example

a) Find the mean score
b) Find the median score
c) The modal score
We can simply make the list of data out of this table, like so, we start with the lowest value
0,0,1,2,2,2,2,4,5,5
Note 0 appears 2 times, 1 appears once, 2 appears 4 times, 3 occurs 0 times, 4 occurs once and 5 occurs twice. (From the table)
a) The Mean = ( 0 + 0 + 1 + 2 + 2 + 2 + 2 + 4 + 5 + 5) / 6
= 23 /10
= Mean is 2.3
b) The Median, the list is already ordered, so firstly workout which item the median is in :
median = (10 + 1) / 2
= 11/2 item
=5.5th item
= Take the 5rd item (2) and 6th item (2)
= Add them up (4)
= Divide by 2 (2)
=Median is 2.
c) The modal score, the most occuring score is 2
Exercise Question 3

Find the
i) Mean
ii) Median
iii) Mode


