SCATTERGRAPH
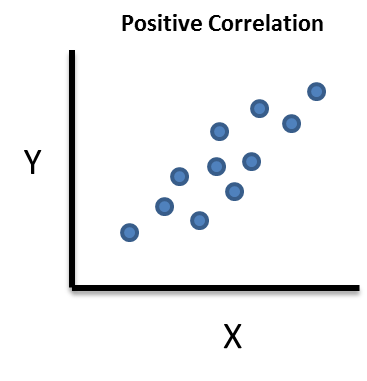
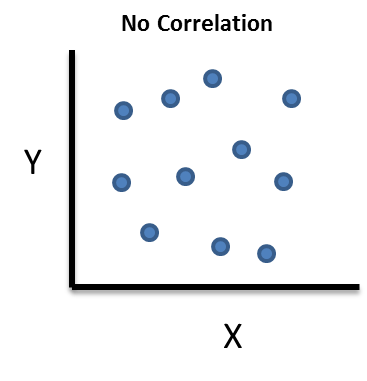
A Scattegraph / Scatter plot, is a graph used to describe the relationship between two variables. There are 3 relationships we need to know about, which we can find through Scatter Graphs, known as Correlations.
1) Positive Correlation
The first relationship we need to know about is a postitive correlation. This is where an increase in Variable X results in an increase in Variable Y. (or vice versa).This is shown diagramatically when the points are more or less, trending diagonally upwards. (not counting for anamolous)
Examples include:
- Higher the number of cigarrettes smoked, the higher the chance of lung cancer
- Higher the number of hours spent studying, the higher the chance of getting a better grade.

2) Negative Correlation
The second relationship we need to know about is a negative correlation. This is where an decrease in Variable X, results in an increase in Variable Y. This is shown diagramatically, when the points are downward sloping (in a diagonal way), again not counting for anamolous results.
Examples include:
- The colder it is outside, the higher your heating bill
- The more traffic there is, the higher the time required to get somewhere.

3) No Correlation
The third and final relationship, is where there is no correlation. In this case, Variable X has no affect on Variable Y. This diagramtically, means the points do not show any general trend, and generally scattered all over the place.
Examples include :
- The amount of food you eat, does not affect your salary.

Example 1)
The scatter graph above shows the relationship between The Life Expectancy of a human in years, and the Birth Rate, in countries.
a) Describe what correlation is shown
b)Draw a line of best fit
c) Estimate What the life expectancy will be at a birth rate of 35 ?
a) As we can see the higher the birth rate, the lower the life expectancy, this means the graph has negative correlation.
b) A line of best fit, is a straight line to be drawn with a ruler, which more or less covers all the points on the graph (which goes through them, so that points are equally distributed and either side of the line):
There could be different lines of best fit, as long as it fits the criteria above.
c) To estimate the life expectancy, at a birth rate of 35. We go to 35 on the x-axis, (birth rate), go up to the line of best fit, and read of the life expectancy. This is approximately 61 years.
STEM AND LEAF DIAGRAMS
A Steam and Leaf Diagram, is another way of represeting Quantitative Data. It is organised by having two parts, which are divided by a vertical line. On the left hand side of the line, is called the Stem, and on the right hand side is called the Leaf.
A Stem and Leaf can be used to organise a list of numbers.
Example :
Draw a stem and Leaf diagram to show the following numbers :
24, 13 , 23 , 30 , 1 ,12 , 15 , 37, 23 , 2, 28 , 36
1) Sort the numbers in ascending order :
1, 2 , 12 , 13 ,15 , 23 , 24 , 28 , 30 , 36 , 37
2) We need to be see what goes in stem part, and leaf part.
The steam represents the first digit of the numbers (for 2 digit numbers), meaning the tens. We can see the stems will be 0 , 1 , 2 , 3
3) Our Leaves correspond to the second digit of the numbers. Here the leaf represents ones.
- If the number are decimals, the same thing applies, the number before the decimal is the stem, and the number after is the leaf.
- If the number is in hundreds ( 3 digits), the first 2 digits are the stem. the last digit is the leaf
- If the same number is in the list more than once, than simply include it on your stem and leaf however much time it occurs
Exercise 2
Draw a stem and leaf diagram for the following numbers :
290, 302, 284, 291, 271, 291, 283


No comments:
Post a Comment